Home BuyingHome Selling August 15, 2018

Generational Trends in Home-Buying

When making an important decision like buying a new home, personal circumstances are often a driving force. Whether you are a first-time homebuyer, need more space for your growing family, downsizing to fit an empty nest, or looking for a retirement property, finding the right information, the right real estate agent, and the right properties that fit your needs are all important parts of that process. Based on recent studies by the National Association of REALTORS®on generational trends, we can identify the best resources to help you in any phase of your life.

Among all generations, the first step most buyers take when searching for a home is online. Younger generations tend to find the home they eventually purchase online, while older generations generally find the home they purchase through their real estate agent.

Across generations, home ownership still represents a significant step in achieving the American Dream. According to a study by LearnVest, an online financial resource, 77 percent of those surveyed believed that buying a home of their own was, “first and foremost in achieving the American Dream”.

How that dream manifests is different for those who have grown up in different eras.


Millennials:

1980-2000

Also known as Generation Y or the Echo Boomers because this generation almost equals the baby boomers in population. This age group is the second largest group of recent homebuyers, representing 28 percent according to the National Association of REALTORS. 79 percent of homebuyers in this age are purchasing their first home. According to the 2012 Trulia American Dream Study, 93 percent of renters in this generation plan on purchasing a home someday.

When considering a home purchase, Millennials (and some Generation X buyers) place a high value on convenience to work, affordability, and the quality of school district. This generation is the most likely to choose an urban center as the location of their first home. According to market research by Gfk Roper, this group is most interested in their home as a social hub, with a focus on entertainment and amenities.

When looking for a real estate agent, Millennials are most likely to looks to friends and family for a referral. They generally place a high value on an agent’s honesty and trustworthiness because they are often relying on their agent to walk them through the home purchase process for the first time.


Generation X:

1965-1979

As the largest group of recent homebuyers, the LearnVest findings suggest that 72 percent of Americans in this generation are already homeowners. They also represent the largest group of home sellers, with a substantial percentage of the group looking to upgrade their home to accommodate their growing families or increase investment. Experts in the real estate industry expect this group to lead in the recovered real estate market.

Generation X households are more likely to have a dual income, with both adult members in the household working. According to a study by GfK Roper, a market research company, this generation placed state-of-the-art kitchens at the top of their priorities, as well as large closets and amenities for organization, since many Gen Xers have children living in their homes. They are less concerned about formality in their home and have less interest in formal dining and living rooms.


Baby Boomers:

1946-1964

Interestingly enough, the NAR study finds that as the age of the homebuyer increases, the age of the home being purchased declines. Baby boomers and older buyers are looking for newer construction, with less need for renovations or large maintenance issues. This generation ranks state-of-the-art kitchens, whirlpool baths, walk-in closets, and hobby spaces high on their list of must-haves, according to GfK Roper.

The boomer generation is also looking to the future for both themselves and their aging parents, “fourteen percent of homebuyers over the age of 48 are looking to purchase senior-related homes, for themselves or others” according to the NAR study. Boomer parents are becoming accustomed to (or preparing for) an empty nest, so this group may be downsizing or looking for a home that specifically fits their needs.


Silent Generation:

1925-1945

This generation of buyers places a bigger emphasis on finding a home closer to friends, family, and health facilities. While this generation uses the Internet to find their home in the early stages of a home search, they work more directly with a trusted real estate agent to find the home that specifically fits their needs. A home purchase for members of this generation will likely not be a first-time experience so they are less willing to compromise on the price, size, or condition of a home.

This generation is generally more satisfied with the homebuying and selling process because they have been through it before and know what to expect. According to the Trulia American Dream study, this group is also most likely to have realistic assumptions about the cost of a home and mortgage.


This was originally posted on the Windermere Blog.

Local Market Update August 13, 2018

Local Market Update – August 2018

For the first time in years, the real estate market is finally starting to deliver good news for buyers. The region experienced its third straight month of significant growth in inventory. Homes are sitting on the market longer, prices are moderating, and multiple offers are becoming more rare. Despite the surge in homes for sale, it is still a seller’s market. Inventory would need to triple to reach what is considered a balanced market.

Eastside

>>>Click image to view full report.

Inventory on the Eastside soared 47 percent over the same time last year. There was a slight increase in new listings, but the jump was mostly due to homes staying on the market longer. Price drops have become more common. With buyers having more choices, sellers need to work with their broker to make sure they price their home correctly the first time. After setting a new high of $977,759 in June, the median price of a single-family home dropped to $947,500 in July. While offering some hope that prices may have started to moderate, the median is still 10 percent higher than it was the same time a year ago.

King County

>>>Click image to view full report.

King County saw the biggest increase in inventory in a decade, with the number of homes for sale jumping 48 percent over a year ago. However, at 1.5 months of supply that’s still well below the 4-6 months of inventory that is considered balanced. The median price of a single-family sold in July was $699,000. That represents an increase of 6 percent from a year ago, but is down 4 percent from the record high of $725,000 set in April. Perceptions that the market is cooling needs to be kept in perspective. Homes here took an average of 15 days to sell.

Seattle

>>>Click image to view full report.

Seattle saw inventory shoot up 60 percent over a year ago, bringing the supply to its highest level in over three years. Even with the sharp increase, much more inventory is needed to meet the demand for homes in the city and sellers may well decide to jump into the market. According to a Zillow study, more than 97 percent of homes in Seattle are worth more now than the peak level before the housing market crashed. Median home prices are 29 percent above the bubble peak level with the median price in July landing at $805,000; up 7 percent from last July and down from the record $830,000 reached in May.

Snohomish County

>>>Click image to view full report.

Snohomish County also had double-digit increases in inventory, though not nearly as great as King County. The number of homes for sale in July increased nearly 16 percent over the same time a year ago, but inventory continues to be very tight. The median price of a single-family home rose 9 percent year-to-year to $495,000. That figure is down from the record high of $511,500 set in June. A move towards a more moderated market is encouraging for buyers and an incentive for sellers to list their homes soon.

This post originally appeared on the WindermereEastside.com Blog.

The Gardner Report July 26, 2018

The Gardner Report – Second Quarter 2018

Gardner Report Q2 2018

The following analysis of the Western Washington real estate market is provided by Windermere Real Estate Chief Economist Matthew Gardner. We hope that this information may assist you with making better-informed real estate decisions.

Economic Overview

The Washington State economy added 83,900 new jobs over the past 12 months, representing an annual growth rate of 2.5%. This is a slowdown from the last quarter, but employment growth remains well above the national rate of 1.6%. Employment gains continue to be robust in the private sector, which was up by 2.8%. The public sector (government) grew by a more modest 1.1%.

The strongest growth sectors were Retail Trade and Construction, which both rose by 4.8%. Significant growth was also seen in the Education & Health Services and Information sectors, which rose by 3.9% and 3.4%, respectively.

The State’s unemployment rate was 4.7%, down from 4.8% a year ago. Washington State will continue adding jobs for the balance of the year and I anticipate total job growth for 2018 will be around 80,000, representing a total employment growth rate of 2.4%.

Home Sales Activity

  • There were 23,209 home sales during the second quarter of 2018. This is a drop of 2.3% compared to the same period a year ago.

  • Clallam County saw sales rise the fastest relative to the same period a year ago, with an increase of 12.6%. Jefferson County also saw significant gains in sales at 11.1%.

  • The number of homes for sale last quarter was down by a nominal 0.3% when compared to the second quarter of 2017, but up by 66% when compared to the first quarter of this year. Much has been mentioned regarding the growth in listings, but it was not region-wide. King County saw a massive 31.7% increase in inventory, though all but three of the other counties covered in this report saw the number of listings drop compared to a year ago.

  • The takeaway from this data is that while some counties are seeing growth in listings — which will translate into sales down the road — the market is still out of balance.

Q2 Annual Change In Home Sales

Home Prices

  • HomePrice Change Map Q2
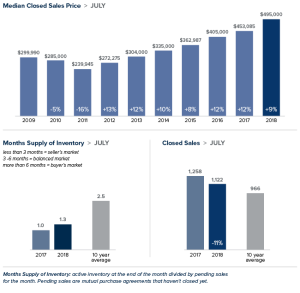
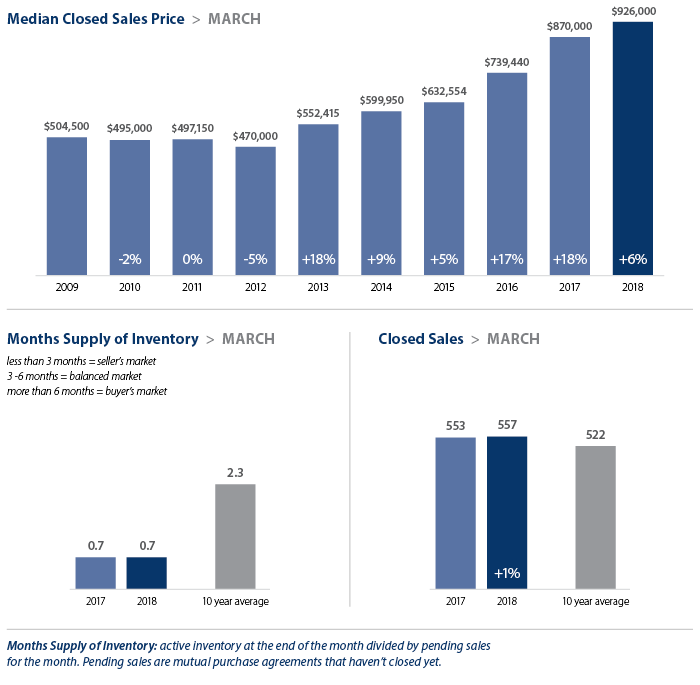
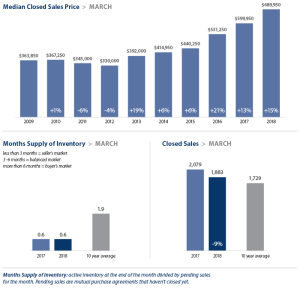
As inventory is still fairly scarce, growth in home prices continues to trend well above the long-term average. Prices in Western Washington rose 12.2% over last year to $526,398.

  • Home prices continue to trend higher across Western Washington, but the pace of growth has started to slow. This should please would-be buyers. The spring market came late but inventory growth in the expensive King County market will give buyers more choices and likely lead to a slowing down of price growth as bidding wars continue to taper.

  • When compared to the same period a year ago, price growth was strongest in Mason County, which was up 17.4%. Eleven other counties experienced double-digit price growth.

  • Mortgage rates, which had been rising significantly since the start of the year, have levelled off over the past month. I believe rising rates are likely the reason that inventory levels are rising, as would-be sellers believe that this could be the right time to cash out. That said, the slowing in rate increases has led buyers to believe that rates will not jump soon, which gives them a little more breathing room. I do not expect to see any possible slowdown in demand until mortgage rates breach the 5% mark.

Days on Market

  • The average number of days it took to sell a home dropped by seven days compared to the same quarter of 2017.

  • King County continues to be the tightest market in Western Washington, with homes taking an average of only 13 days to sell. Every county in the region other than Clallam saw the length of time it took to sell a home drop when compared to the same period a year ago.

  • Across the entire region, it took an average of 41 days to sell a home in the second quarter of this year. This is down from 48 days in the second quarter of 2017 and down by 20 days when compared to the first quarter of 2018.

  • Although we did see some inventory increases when compared to the first quarter of the year, we are essentially at the same level of homes on the market as a year ago. The market has yet to reach equilibrium and I certainly do not expect to reach that point until sometime in 2019.

Average Days On Market, Q2 2018

Conclusions

Market Speedometer

This speedometer reflects the state of the region’s real estate market using housing inventory, price gains, home sales, interest rates, and larger economic factors. For the second quarter of 2018, I have moved the needle very slightly towards buyers, but it remains firmly a seller’s market. This shift is a function of price growth tapering very slightly, as well as the expectation that we should see more homes come on the market as we move through the balance of the year.


Matthew Gardner is the Chief Economist for Windermere Real Estate, specializing in residential market analysis, commercial/industrial market analysis, financial analysis, and land use and regional economics. He is the former Principal of Gardner Economics, and has more than 30 years of professional experience both in the U.S. and U.K.


This post originally appeared on the Windermere.com Blog.

Uncategorized July 13, 2018

Market Update – July 2018

The local real estate market looks like it might finally be showing signs of softening, with inventory up and sales down. More sellers have opted to put their homes on the market. Inventory was up 47 percent in King County and price increases were in the single digits. Despite the increase in inventory and slowdown in sales, it’s still a solid seller’s market. Over half the properties purchased in June sold for more than list price.

Eastside

>>>Click image to view full report.

A booming economy offered little price relief for buyers looking on the Eastside. In a recent study of economic strength by state, Washington ranked number one in the country. An additional report targeting cities ranks the Seattle-Bellevue-Tacoma market as the nation’s fourth strongest economy. The median price of a single-family home on the Eastside rose 10 percent over a year ago to $977,759 setting another record. There is some good news for buyers. Inventory rose to its highest level in three years, with the number of homes for sale increasing 46 percent from the same time last year.

King County

>>>Click image to view full report.

The number of homes on the market in King County soared 47 percent from a year ago, the biggest increase since the housing bubble burst. Despite the increase, there is just over one month of available inventory, far short of the four to six months that is considered a balanced market. The median price of a single-family home increased 9 percent over last June to $715,000. That’s down 2 percent from the $726,275 median in May. Home prices haven’t dropped from May to June in King County since the last recession.

Seattle

>>>Click image to view full report.

Seattle trails only Bay Area cities when it comes to greatest profits for home sellers. That may help explain the surge in inventory in June. For example, the number of homes for sale in the popular Ballard/Green Lake area doubled from a year ago. Even though buyers are finally getting more choices, demand still exceeds supply. Homes sell faster in Seattle than in any other U.S. real estate market. That demand propelled the median price of a single-family home to $812,500; up 8 percent over last June and down from the record $830,000 set in May.

Snohomish County

>>>Click image to view full report.

The largest jump in home prices in the region came in Snohomish County. While higher-priced markets in King County are seeing increases slowing slightly, the median price of a single-family home here jumped 14 percent to $511,500, a new high for the county. Buyers willing to “keep driving until they can afford it” are finding Snohomish County an appealing destination.

This post originally appeared on the WindermereEastside.com Blog.

For Your Home June 15, 2018

Three Deck Design Ideas To Get Your Yard Ready For Summer

A delightfully warm spring in many parts of the Western U.S. had many folks brushing off their summer clothing early. While this is exciting for all who love the outdoors, public spaces like parks and beaches may be overcrowded. What better time to focus on ways to maximize the space you have in your own home? There’s no one ideal way to set up your deck, but we’ve put together a few of our favorite ideas to help inspire your next redesign.

Multi-level Decks


Credit: H. Camille Smith / HGTV

Credit: H. Camille Smith / HGTV


  • Especially if your square footage is limited, tiering your deck into multiple levels is a great way to incorporate extra outdoor space into your home.
  • By separating your deck into multiple levels, even slightly, you can create a cozy sense of separation between spaces.
  • Give yourself options for privacy. Depending on your property, the base level of your deck may be below your fence-line. If you have a view you’d like to enjoy with your barbecue, consider a second tier.

Built-in Seating

Credit: lizmarieblog.com

Credit: lizmarieblog.com


  • A simple way to save space and hassle is to build in your seating spaces during your deck’s construction.
  • It’s important to consider what you will predominantly be doing on your deck. Lounging while reading? A corner bench is a great fit and can be outfitted comfortably. Potlucks and cookouts? Consider higher benches or fences with wide tops for easy plate placement.
  • Consider your environment. If your deck will weather rain, sand, or wind consistently, don’t write off surfaces like brick and concrete, which can be framed as appealingly as wood or other stone.

Custom Lighting

Credit: istikharawazifa.com

Credit: istikharawazifa.com


  • As the sun fades, your deck’s utility can shine or fade with it. Including discreet lighting within the construction of your deck is a small step that can pay huge dividends.
  • Increasingly popular low-voltage systems have made a well-lit backyard and deck drastically more affordable.
  • Depending on your location, solar powered lighting is a worthwhile investment that can help accentuate your stairs, fences, and other outdoor decorations.

This post originally appeared on the Windermere.com Blog. 

Local Market Update June 15, 2018

Local Market Update – June 2018

Last month brought some long-awaited, positive news for buyers with May posting the most new listings in over a decade. Despite the uptick in inventory, most homes are selling in less than a month. Prices haven’t been impacted either, with the majority of the region continuing to experience double-digit home price increases.

Eastside

>>>Click image to view full report.

The median home price on the Eastside hit an all-time high of $960, 000 in May; a 10 percent gain over the same time last year. While there were a third more homes for sale in May than a year ago, the area still had only about a month of available inventory. Three to six months is considered a balanced market. Redmond, a city with a population of 64,000, currently has only 51 single-family homes on the market.

King County

>>>Click image to view full report.

First the good news: Those looking to buy a home in King County in May had almost 1,000 more homes to choose from compared to the previous month. The bad news: That boost in inventory did little to moderate home prices. The median price for a single-family home jumped 15 percent to $726,275, up slightly from the record high set in April.

Seattle

>>>Click image to view full report.

A strong economy and desirable lifestyle have kept Seattle a leading destination for job-seekers. The ever-increasing demand for housing has sapped supply and sent prices soaring. For 19 months Seattle has led the nation in rising home prices.  May saw the city set yet another record, with the median home price jumping 14 percent to $830,000.

Snohomish County

>>>Click image to view full report.

Soaring prices in King County combined with rising interest rates make Snohomish County an affordable alternative for those willing to extend their commute time.  The typical home cost $500,000 in May, an increase of 11 percent over the previous year, and down very slightly from last month.

This post originally appeared on the WindermereEastside.com Blog. 

For Your Home June 4, 2018

Understanding the Modern Home


Sleek design, open floor plans, and great natural lighting are all appealing characteristics of modern architecture. Over the years, modern design concepts in home building have become more popular, as is the resurgence of interest in modern real estate. More companies, like 360 modern, are specializing in modern properties. Modern homes vary greatly in style; however, they have some unifying qualities that distinguish them from other properties built over the last 60 years. Here are some characteristics often found in modern homes:

Clean geometric lines: The core of modernist values is the simplification of form. Modernist homes have a very ‘linear’ feel with straight lines and exposed building materials. Furnishings and adornment reflect this value, incorporating vibrant, geometric and abstract designs.

Modern materials: Large windows are abundant in modern architecture, allowing light to fill and expand the interior space, bringing the natural world indoors. Generally, all exposed building materials are kept close to their natural state, including exposed wood beams, poured concrete floors or countertops, stone walls and stainless steel.

Modern homes are well suited for technological and green upgrades, as well including eco-friendly building materials and energy efficient practices. Flat roofs accommodate solar power. Energy efficient appliances work with the aesthetics of modern homes. Modernist landscaping need not require water-thirsty lawns but instead can reflect local flora.

Post-and-beam structure: One classic element in modern architecture is the exposed wood posts and ceiling beams. This style of building has been around for thousands of years; however, modern homes really emphasize the structure, rather than hiding the bones behind drywall. In new modern homes, the post-and-beam structure can be made out of concrete, iron or other materials. The highly visible horizontal and vertical beams reinforce the clean geometric lines of the space.

Low-pitched gable or shed roof: One of the most differential characteristics of modern homes than more traditional home design is the shape of the roof. Classic modern homes on the west coast generally have a flat or low-pitched roof, highly influenced by architect Joseph Eichler. New urban homes also leverage rooftops for outdoor entertaining space.

Open floor plan: Modern design strives to “open” the space by eliminating enclosed rooms. For example opening the kitchen and dining room into an open living space, allowing the ‘rooms’ to flow into one another.

Large windows: Natural light and the incorporation of natural elements are important aspects of modern home design. Large, floor-to-ceiling windows illuminate the open space and highlight the natural landscape. Some new modern homes have adjusted the large windows to open, diminishing the barrier between the indoors and out.

Incorporation of outdoor elements: Frank Lloyd Wright, one of the pioneering modernist architects, incorporated the natural setting into his architecture, most famously with Falling Water. Outdoor elements are incorporated into modern architecture in many ways; through large windows, landscaped terraces, and patios, and through use of natural and organic materials in the building including stone walls, and more.

Minimalism: With open and connected modernist spaces, careful curation of furniture, adornments, and household objects is important to preserving the modernist aesthetic. Generally, modernist homes have art and furniture that reflects the clean geometric lines and the natural materials of the architecture, leaving less space for clutter. Minimalist philosophies of few household items that serve both form and function work well within this design and architectural style.

This post was originally published on the Windermere.com Blog.

Local Market Update May 17, 2018

Local Market Update – May 2018

Another month, another record. Despite a slight uptick in inventory that showed the highest level of active listings since last August, both King and Snohomish counties saw home prices in April hit all-time highs. There is less than one month of inventory available in both counties, far below the four to six months of supply that is considered “balanced.” As long as the severe shortage of homes remains, improving supply is unlikely to reverse rising prices.

Eastside

>>>Click image to view full report.

With the median price on the Eastside hovering at just under $1 million, you’d expect a softening of the market. Instead, sales were strong at every price point. The median price of $943,000 was a slight dip from the record of $950,000, but up 7 percent from last April. That does show some price moderation. According to Windermere Chief Economist Matthew Gardner, mortgage rates are expected to increase modestly in the coming months, which he predicts should further moderate price growth.

King County

>>>Click image to view full report.

After setting a record in March, the median price of a single-family home in King County hit a new high of $725,000 in April. Prices soared 16 percent over a year ago, an increase of $100,000. The rising cost of both rental and home prices is taking its toll. According to a new study, 68 percent of King County residents rate the quality of life here as high but 35 percent said the cost of living is the worst problem in the county.

Seattle

>>>Click image to view full report.

The median cost of a single-family home in Seattle was $819,000, unchanged from March but up 13 percent from a year ago. There doesn’t appear to be any price relief in the near future. The booming job market in Seattle continues to fuel housing demand that far exceeds supply. As a result, home prices are predicted to rise at above-average rates in the coming year.

Snohomish County

>>>Click image to view full report.

In Snohomish County, the median price of a single-family home exceeded half a million dollars, setting a new record for the region. The typical home cost of $505,975 in April was up 15 percent over the same time last year. Despite record-setting prices, the area continues to draw buyers seeking to find more affordable housing options. Of the 100,000+ people who leave King County each year, the majority move to Snohomish County.

The Gardner Report April 30, 2018

The Gardner Report – First Quarter 2018


The following analysis of the Western Washington real estate market is provided by Windermere Real Estate Chief Economist Matthew Gardner. We hope that this information may assist you with making better-informed real estate decisions.

Economic Overview

The Washington State economy added 96,900 new jobs over the past 12 months, representing an annual growth rate of 2.9%—still solidly above the national rate of 1.5%. Most of the employment gains were in the private sector, which rose by 3.4%. The public sector saw a more modest increase of 1.6%.

The strongest growth was in the Education & Health Services and Retail sectors, which added 17,300 and 16,700 jobs, respectively. The Construction sector added 10,900 new positions over the past 12 months.

Even with solid increases in jobs, the state unemployment rate held steady at 4.7%—a figure that has not moved since September of last year.

I expect the Washington State economy to continue adding jobs in 2018, but not at the same rate as last year given that we are nearing full employment. That said, we will still outperform the nation as a whole when it comes to job creation.

Home Sales Activity

  • There were 14,961 home sales during the first quarter of 2018. This is a drop of 5.4% over the same period in 2017.
  • Clallam County saw sales rise the fastest relative to the first quarter of 2017, with an increase of 16.5%. In most of the other markets, the lack of available homes for sale slowed the number of closings during this period.
  • Listing inventory in the quarter was down by 17.6% when compared to the first quarter of 2017, but pending home sales rose by 2.6% over the same period, suggesting that closings in the second quarter should be fairly robust.
  • The takeaway from this data is that the lack of supply continues to put a damper on sales. I also believe that the rise in interest rates in the final quarter of 2017 likely pulled sales forward, leading to a drop in sales in the first quarter of 2018.

Annual change in home sales

Home Prices

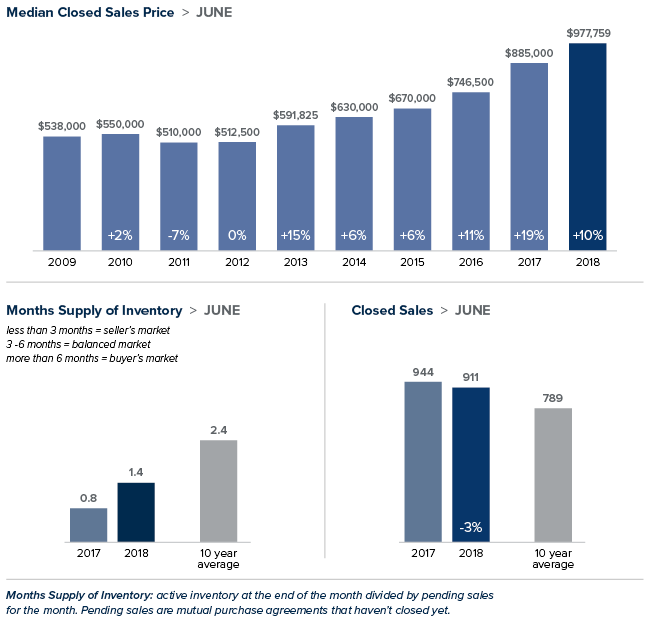
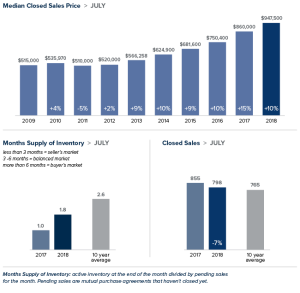
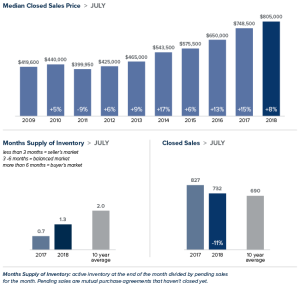
  • With ongoing limited inventory, it’s not surprising that the growth in home prices continues to trend well above the long-term average. Year-over-year, average prices rose 14.4% to $468,312.
  • Economic vitality in the region is leading to robust housing demand that far exceeds supply. Given the relative lack of new construction homes— something that is unlikely to change any time soon—there will continue to be pressure on the resale market. As a result, home prices will continue to rise at above-average rates in the coming year.
  • When compared to the same period a year ago, price growth was strongest in Grays Harbor County at 27.5%. Ten additional counties experienced double-digit price growth.
  • Mortgage rates continued to rise during first quarter, and are expected to increase modestly in the coming months. By the end of the year, interest rates will likely land around 4.9%, which should take some of the steam out of price growth. This is actually a good thing and should help address the challenges we face with housing affordability—especially in markets near the major job centers.

Annual change in home sale prices Q1

Days on Market

  • The average number of days it took to sell a home dropped by seven days when compared to the same quarter of 2017.
  • King County continues to be the tightest market in Western Washington, with homes taking an average of 24 days to sell. Every county in the region saw the length of time it took to sell a home either drop or remain essentially static relative to the same period a year ago.
  • In looking at the entire region, it took an average of 61 days to sell a home in the first quarter of this year. This is down from 68 days in the first quarter of 2017 but up by eleven days when compared to the fourth quarter of 2017.
  • Anyone expecting to see a rapid rise in the number of homes for sale in 2018 will likely be disappointed. New construction permit activity—a leading indicator—remains well below historic levels and this will continue to put increasing pressure on the resale home market.

Average Days On Market

Conclusions

Market SpeedometerThis speedometer reflects the state of the region’s housing market using housing inventory, price gains, home sales, interest rates, and larger economic factors. For the first quarter of 2018, I have left the needle at the same point as fourth quarter of last year. Price growth remains strong even as sales activity slowed. All things being equal, 2018 is setting itself up to be another very good year for sellers but, unfortunately, not for buyers who will still see stiff competition for the limited number of available homes for sale.


Matthew Gardner is the Chief Economist for Windermere Real Estate, specializing in residential market analysis, commercial/industrial market analysis, financial analysis, and land use and regional economics. He is the former Principal of Gardner Economics, and has more than 30 years of professional experience both in the U.S. and U.K.

This article originally appeared on the Windermere.com blog.

Local Market Update April 23, 2018

Local Market Update – April 2018

Despite the typical seasonal surge in new listings, supply in our area continued to fall far short of demand in March. With just two weeks of available inventory in every market, competition for homes is intense. The result was another month of double-digit price increases as compared to a year ago. The region has now led the country in home price increases for 17 months in a row. The prediction for the spring market: HOT with no signs of cooling.

Eastside

>>>Click image to view full report.

The median price of a single-family home was up 6 percent over last March to $926,000, down slightly from the record-setting price last month. Sales were brisk at every price, including the luxury market. Sales of homes priced at $2 million or more were up 23 percent in the first quarter of 2018 as compared to the previous year.

King County

>>>Click image to view full report.

A booming economy combined with insufficient inventory propelled prices to an all-time high in March. The median price of a single-family home in King County jumped 15 percent to $689,950. Multiple offers remain the norm. Buyers here need to plan on moving very quickly and working with their agent on strategies to navigate bidding wars.

Seattle

>>>Click image to view full report.

The median home price in Seattle set a new record of $819,500 in March, up a whopping 17 percent from a year ago. Homes are selling within days of being listed. Only 19 single-family homes are currently on the market in Ballard and just 24 in Queen Anne. South Seattle, traditionally the most affordable part of the city, has seen the greatest increase in prices. Home values in these neighborhoods have nearly tripled since the recession ended, while home values in the rest of the city have doubled.

Snohomish County

>>>Click image to view full report.

Once a less competitive market than King County, Snohomish County now has the lower amount of inventory of the two. The median price of a single-family home grew 12 percent over a year ago to $475,000. Prices here remain significantly lower than in King County and many buyers priced out of that market are trading a longer commute time for the opportunity of ownership.